The reporting problem in product-led growth is not a shortage of numbers. Product analytics will happily produce hundreds. The problem is that the numbers live in different systems from the ones the board looks at, and the metrics that predict revenue are usually not the metrics that are easiest to show.
Blake Bartlett put the reporting challenge well in his Sacra interview: evaluating a product-led company means using both a traditional B2B and a consumer mindset. The classic SaaS measures still matter, including revenue growth, gross and net retention, and CAC payback period, while a self-service funnel also needs sign-ups, activation rate, short-window retention and conversion to paid. He notes these are more relevant top-of-funnel measures for PLG than traditional marketing-qualified leads.
This article sets out which metrics matter at each stage, how to calculate them without fooling yourself, and how to tell whether the model is actually becoming more efficient.
Quick Takeaway
The metric that decides most product-led businesses is activation rate, because every downstream number is a fraction of it. If you can only instrument one thing properly this quarter, instrument the activation moment and the time it takes to reach it.
Product-led growth metrics are the measures that show whether users reach value, come back, pay, expand, and cost less to acquire over time than they are worth.
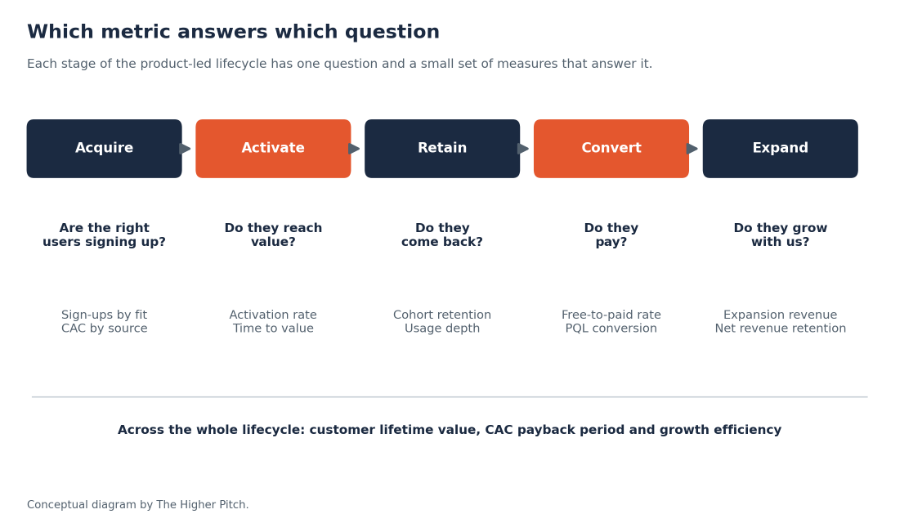
Figure 1: Which metric answers which question. Conceptual diagram.
Product Activation Rate: the Metric Everything Else Depends On
Activation rate is the share of new users or accounts that reach a defined first-value moment within a set period.
Calculate it as activated users divided by new users in the same cohort, with both the activation event and the window defined in advance. Report it by cohort, never as a running total, and segment by role, company size and acquisition source.
Two traps are worth naming. The first is defining activation as a step you control, such as completing setup, rather than an outcome the user values. The second is not checking whether activated users actually convert better than unactivated ones; if they do not, the definition is measuring the wrong thing. How to find the right definition is covered in Product-Led Onboarding.
Time to Value: How Long the User Waits for a Reason to Stay
Time to value is the elapsed time from sign-up to activation.
Report the median rather than the mean, since a small number of users returning weeks later will distort an average. It is also worth tracking the distribution, because a bimodal pattern usually means two different types of user are being served by one onboarding flow.
Bartlett’s benchmark for self-service journeys is to deliver the aha moment in the first or second session, and he argues that AI has raised expectations, since products that deliver something impressive within seconds have become the reference point.
Product Adoption and Usage: Depth, Not Logins
Logins are a weak proxy for value. Better measures include:
- Depth of use: the share of activated accounts using the features that correlate with retention.
- Breadth within the account: active users as a proportion of the seats or the addressable team.
- Frequency against the natural rhythm of the job. Daily use is meaningless for a product used at month end; the right measure is whether the account uses it every time the task occurs.
That last point matters more in B2B than the daily and weekly active user ratios borrowed from consumer products. A quarterly planning tool used every quarter is perfectly healthy.
Free-to-Paid Conversion Rate: Measure It by Cohort, and Expect It to Be Low
Free-to-paid conversion rate is the share of free users or accounts that become paying customers within a defined window.
Always calculate it on a cohort that has had the full window to convert. Aggregate conversion rates move whenever sign-up volume changes, which makes them useless for judging whether anything improved.
On the level, be realistic. Atlassian’s FY2024 annual report states that, historically, a majority of users never convert to a paid version from free trials or limited free versions. You will find specific conversion benchmarks quoted widely online; we have not found a primary B2B source for them that is still published, so we would not plan against them. Build the case on your own cohorts.
Product-Qualified Leads: Behaviour as a Buying Signal
A product-qualified lead is a user or account that has used the product and reached pre-defined triggers signalling a strong likelihood of becoming a paying customer.
That definition comes from Tomasz Tunguz’s 2013 post popularizing the term. Two points from it are still the most useful guidance available: each product needs its own PQL definition because each measures engagement differently, and the best definitions are informed by conversion correlation data rather than intuition. Tunguz also observed at the time that when sales teams called PQLs, customers typically converted at about 25 to 30%. That was his observation of the companies he worked with in 2013, not a benchmark from a published study, and it should be treated as illustrative rather than as a target.
Metrics worth tracking around PQLs:
- PQL volume per period, by segment.
- PQL-to-paid conversion rate, compared against your own non-PQL baseline.
- Time from PQL trigger to first contact, which is usually the easiest thing to improve.
- PQL precision, the share of flagged accounts that a rep judges genuinely ready, which keeps the criteria honest.
Retention and Churn: Usage Leads, Revenue Follows
In self-service motions, churn is often silent. Nobody cancels; they simply stop. Measure both:
- Usage retention by cohort: the share of activated accounts still meaningfully active at week four, week twelve and so on.
- Logo churn and revenue churn for paying customers, reported separately, since losing many small accounts and one large one are different problems.
- Leading indicators: falling active users within an account, a drop in the feature that correlates with retention, and admin changes such as a champion leaving.
The last is a particularly B2B failure mode. An account can look healthy right up to the moment the person who championed it changes jobs.
Expansion Revenue and Net Revenue Retention
Expansion revenue is additional revenue from existing customers through more seats, higher usage or additional products. Net revenue retention (NRR) is revenue from an existing cohort at the end of a period divided by revenue from that cohort at the start, including expansion and net of contraction and churn.
NRR is the single number that tells a board whether a product-led model compounds. Above 100%, the existing base grows without new customers. Below, the business must acquire to stand still.
Two cautions when reporting it: state the cohort window and whether new customers are excluded, since definitions differ between companies, and read NRR alongside gross retention. Strong expansion in a few large accounts can hide widespread churn in small ones, which is the specific risk in businesses with a long tail of self-service customers.
Customer Acquisition Cost and Lifetime Value, by Motion
Customer acquisition cost is the fully loaded sales and marketing cost of winning new customers in a period, divided by the number won. Customer lifetime value is the total gross margin expected from a customer over the relationship.
For product-led businesses, three adjustments make these meaningful:
- Split CAC by motion. Self-service and sales-assisted customers have different economics, and a blended figure hides both.
- Include the cost of serving free users. Infrastructure, support and the product investment that makes self-service possible are part of the cost of the motion, even though they are not marketing spend.
- Lead with CAC payback period. Bartlett names payback among the classic SaaS measures that still matter, and it answers the CFO’s real question: how long until this customer has paid for itself.
On LTV to CAC ratios, you will see thresholds quoted confidently. We have not found a primary B2B study behind the common figures, so set your own threshold from your margins, cash position and payback period instead of borrowing one. The same caution applies in our growth loop metrics article.
Growth Efficiency: Is the Model Actually Getting Better?
Four tests, read over successive periods, show whether a product-led motion is improving rather than simply growing:
- Activation rate rises or holds while sign-up volume grows. Falling activation with rising sign-ups means acquisition is outrunning the product.
- Time to value falls.
- Free-to-paid conversion holds or rises by cohort, not in aggregate.
- CAC payback shortens, or NRR rises enough to offset it.
If sign-ups are the only number improving, the motion is generating volume rather than customers.
| Metric | How to calculate it | Review cadence | Typical owner |
| Activation rate | Activated users divided by new users, same cohort | Weekly | Growth or product |
| Time to value | Median days from sign-up to activation | Weekly | Growth or product |
| Usage retention | Active accounts at week 4 and week 12, by cohort | Monthly | Product |
| Free-to-paid conversion | Converted accounts divided by cohort with a full window | Monthly | Growth and finance |
| PQL volume and conversion | Accounts meeting triggers; share becoming paid | Monthly | RevOps and sales |
| Net revenue retention | Cohort revenue at end divided by revenue at start | Quarterly | Finance |
| CAC by motion and payback | Fully loaded cost divided by customers won, by motion | Quarterly | Finance and RevOps |
Table 1: A starting PLG metrics scorecard.
Each Leader Needs a Different View of the Same Model
| Leader | Question they ask | Metrics to show them |
| CEO or founder | Is the model working without more headcount? | Activation rate, NRR, CAC payback by motion |
| CFO | When does this pay back, and what does the free tier cost? | CAC payback, fully loaded cost to serve free users, cohort conversion |
| CRO or sales leader | Are product-qualified leads worth a rep’s time? | PQL volume, PQL-to-paid rate against baseline, time to contact |
| Chief product officer | Where is the product losing people? | Step conversion, time to value, usage retention |
| RevOps or CIO | Can we trust these numbers? | Event coverage, account identity matching, CRM data quality |
Table 2: The internal buying-committee lens on PLG metrics.
None of this works without instrumentation and clean account identity. Product events have to map to CRM records, and self-service sign-ups have to resolve to accounts rather than a pile of personal email addresses. Start with the signs that your CRM data is holding back growth, our HubSpot implementation guide and the RevOps playbook. For the measurement stack more broadly, see customer experience analytics.
Author