A growth loop can look as if it is failing in every standard report and still be the healthiest part of the business. Channel dashboards credit the last touch. Funnel reports measure stage conversion. Neither is built to see an output that comes back months later as a referral, a reused case study or a page that suddenly starts converting.
That is why loop programs are so often cut early, and why the measurement model matters as much as the loop design. This article sets out what B2B companies should measure at each stage, the two metrics that are specific to loops (velocity and loop conversion rate), how acquisition cost and lifetime value behave when a loop is working, and how to tell genuine compounding from coincidence.
Quick Takeaway
- Measure a loop by what one cycle returns and how long it takes, not by channel totals. If each cycle returns more usable input than it consumed, and cycles are getting faster, the loop is compounding, even while last-touch reports give the credit to something else.
- Growth loop metrics are the measures that show how much input a loop receives, how much of that input produces a reusable output, how quickly that output is reinvested, and whether each cycle generates more new input than the one before.
Stage Metrics Still Matter, but Read Them as Links in One Chain
The subtopics most teams already track (acquisition, activation, retention and referral) come from funnel thinking. The AARRR framework that popularized them was created by Dave McClure, as Brian Balfour of Reforge notes, and the same Reforge authors warned that funnels create functional silos in which teams optimize at each other’s expense.
The fix is not to abandon stage metrics but to read them as links in a chain. In a loop, a weak retention number is not only customer success’s problem, because the retained customer base is the stock that referral and advocacy draw on. Each stage metric below is framed around its role in the loop.
Acquisition Metrics Should Separate Loop-Sourced From Bought Input
Acquisition in a loop has two sources: input you buy (paid media, events, outbound) and input the loop generates (referrals, advocacy-influenced evaluations, organic discovery). If you cannot separate them, you cannot tell whether the loop is working.
- New inputs by source: new leads, evaluations or accounts, split into bought, loop-sourced and loop-influenced.
- Share of pipeline from loop sources: the proportion of new pipeline where a loop output was the original source or a documented influence.
- Self-reported source: a required “how did you first hear about us?” field on key forms and in discovery calls. Much B2B research happens where tracking cannot follow; G2’s April 2026 research found half of B2B software buyers (51%) now begin research with an AI chatbot more often than with Google.
Activation Metrics Show Whether New Inputs Can Feed the Loop
Activation in B2B means reaching the state in which a new customer can become a loop input. That state depends on the loop: first measurable value for a product loop, a defined project milestone for a services firm, a verifiable outcome for an advocacy loop.
- Time to first value: how long it takes a new customer to reach a defined outcome.
- Loop-eligible rate: the share of new customers who reach the state that triggers the loop within an agreed period.
If activation is slow, the loop is slow, no matter how well the rest of it is designed.
Retention Metrics Decide How Large the Loop Can Grow
Loops draw on the customer base. Every customer lost is a potential referrer, reference or data source removed from the stock.
- Logo retention: the share of customers who stay over a period.
- Net revenue retention: revenue retained from existing customers, including expansion and net of contraction and churn.
- Depth of engagement: usage, program participation or relationship breadth, depending on your business.
Read retention as the size of the tank the loop draws from. A loop with falling retention can show rising referral numbers for a while, then stall as the stock drains.
Referral Metrics Measure the Output That Comes Back
These metrics show whether the loop is actually returning input:
- Introductions per 100 active accounts per year: a B2B-friendly version of the viral coefficient, which in consumer products is usually calculated as invitations per user multiplied by the invitation conversion rate.
- Referral-to-opportunity rate: the share of introductions that become qualified opportunities.
- Referred win rate compared with baseline: whether referred opportunities close more often than others in your own data.
- Advocacy participation: references, case studies, reviews and speaking slots secured per period.
Measure these against your own baseline rather than an industry figure. Referral dynamics vary too much by category for borrowed benchmarks to be useful.
Loop Velocity: The Metric That Turns Good Loops Into Compounding Ones
Loop velocity is the time it takes to complete one full cycle of a loop, from the trigger to the reinvested output generating new input. It is the metric most teams do not track, and the one with the largest effect on compounding.
The reason is arithmetic. If each cycle returns more input than it started with, the number of cycles completed in a year matters as much as the return per cycle. Figure 1 shows the same loop with the same return per cycle, run on a 90-day cycle and a 45-day cycle.
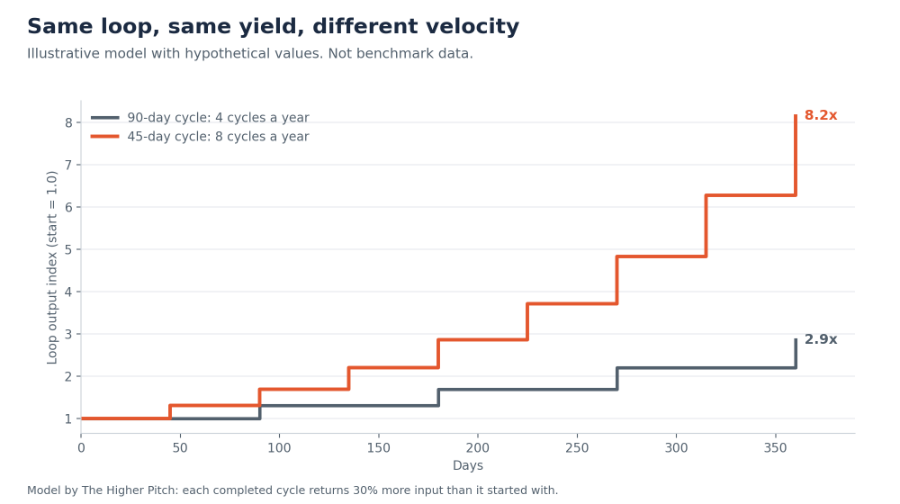
Figure 1: Illustrative model with hypothetical values, not benchmark data. With each cycle returning 30% more input than it started with, four cycles a year produce roughly 2.9 times the starting output, while eight cycles produce roughly 8.2 times.
To measure velocity, timestamp each step of the loop in your CRM: trigger date, participation date, output approved date, first reuse date and the date of the first new input attributed to that output. The gaps between timestamps show where the cycle slows down, which is usually where to act first. The build process for this is in How to Build a B2B Growth Loop From Scratch.
Loop Conversion Rate Shows Where the Loop Leaks
Loop conversion rate is the share of inputs at each step that successfully move to the next step, and, end to end, the share of triggers that produce a reinvested output. It is the loop’s equivalent of funnel conversion, applied to the return path.
| Loop step | Conversion to measure | Example (customer advocacy loop) |
| Trigger to participation | Share of triggers where the participant agrees to take part | Customers at their milestone who agree to an outcome story |
| Participation to output | Share of participations that produce a usable asset | Stories approved for external use |
| Output to reuse | Share of outputs actually used where they were meant to be used | Approved stories used in at least one live deal |
| Reuse to new input | Share of reused outputs linked to a new input | Stories referenced by new evaluators or used in won deals |
Table 1: Measuring loop conversion step by step.
A related measure is yield per cycle: how many new inputs each completed cycle generates. When yield is above what the cycle consumed, and rising, the loop is compounding.
CAC Should Fall by Source Over Time; Blended CAC Can Hide It
Customer acquisition cost (CAC) is the total sales and marketing cost of winning new customers in a period, divided by the number of new customers won. For loops, the useful view is CAC by source, not the blended figure.
Loop-sourced customers should, over time, cost less to acquire, because the input was generated rather than bought. But two cautions apply. First, include the cost of building and running the loop, including people’s time, or loop CAC will look artificially low. Second, watch blended CAC as well, because a cheap loop that brings in poor-fit customers can lower acquisition cost while damaging retention.
LTV Shows Whether Loop-Sourced Customers Are Worth Having
Customer lifetime value (LTV) is the total gross margin a company expects to earn from a customer over the relationship. Compare LTV by acquisition source, using your own cohorts.
The question is not only whether loop-sourced customers are cheaper, but whether they stay, expand and in turn feed the loop. You will see rules of thumb for the ratio of LTV to CAC quoted widely. We have not found a primary B2B study behind them, so set your own threshold based on your margins, cash position and payback period rather than borrowing one.
Who Needs Which Loop Metric
Loop metrics serve an internal buying committee: the leaders who fund, run and judge the loop. Each needs a different view.
| Leader | Question they ask | Metrics to show them |
| CEO or founder | Is growth becoming less dependent on spend? | Share of pipeline from loop sources, yield per cycle |
| CFO | Does the loop pay back, and when? | CAC and LTV by source, fully loaded loop cost, payback period |
| CMO | Is the loop working, and where is it stuck? | Loop velocity, loop conversion by step, input volume |
| CRO or sales leader | Are loop-sourced deals good deals? | Referred and advocacy-influenced win rates, deal size, cycle length |
| RevOps or CIO | Can we trust the numbers? | Source integrity, timestamp completeness, data quality checks |
Table 2: The internal buying-committee lens for loop metrics.
Measuring Compounding: Four Tests
A loop is compounding, rather than merely busy, when it passes these four tests over successive periods:
- Cohort yield rises: each new cohort of loop outputs generates at least as much new input as the previous cohort.
- Loop-sourced share grows at stable quality: the share of pipeline from loop sources increases while win rates and retention hold.
- Velocity improves: the time to complete a cycle falls.
- Marginal cost falls: the fully loaded cost per loop-sourced opportunity declines.
If only the first test passes, you may be seeing a good quarter rather than a compounding loop. If all four pass, you have evidence a CFO can accept.
| Metric | How to calculate it | Review cadence | Typical owner |
| Loop input volume | Count of triggers starting a cycle in the period | Monthly | Loop owner |
| Loop conversion rate | Reinvested outputs divided by triggers | Monthly | Loop owner |
| Loop velocity | Median days from trigger to first new input | Monthly | Marketing operations |
| Yield per cycle | New inputs generated per completed cycle | Quarterly | Marketing and RevOps |
| CAC by source | Fully loaded cost divided by new customers, by source | Quarterly | Finance and RevOps |
| LTV by source | Expected lifetime gross margin, by acquisition cohort | Twice a year | Finance |
Table 3: A starting loop metrics scorecard.
None of this works without reliable data. If sources are overwritten or stages skipped, start with the signs that your CRM data is holding back growth and our RevOps playbook. For AI visibility as a loop output, see share of AI voice; for the search-specific version of these metrics, see SEO Growth Loops.
THP Studio Perspective
- One caveat belongs in front of every leadership team: loop metrics are only as honest as the CRM behind them. If sources are overwritten, stages are skipped and referrals are logged as “other”, the dashboard will show a funnel whatever is happening in the market. Before debating loop velocity, spend a month making sure every step leaves a timestamp and every opportunity keeps its original source. It is dull work. It is also the difference between a loop you can defend to a CFO and one you have to take on faith.
Frequently Asked Questions
Key Takeaways
- Split acquisition into bought, loop-sourced and loop-influenced input, or you cannot tell whether a loop is working.
- Track loop velocity, because the number of cycles a year matters as much as the return per cycle.
- Measure loop conversion at every step of the return path to find exactly where the loop leaks.
- Use CAC and LTV by source with fully loaded loop costs, and set your own thresholds rather than borrowing unverified ratios.
- Fix source integrity and timestamps first; without them, every loop metric is a guess.
Work With THP’s HubSpot Consulting Practice
- THP’s HubSpot Consulting team helps B2B companies implement and optimize HubSpot as a CRM, so that sources, stages and handoffs are recorded reliably enough to measure what matters. If your reporting cannot yet tell a loop from a funnel, we can help you build the fields, workflows and dashboards that will.
Author