Ask most B2B companies where revenue comes from and the answer describes acquisition: campaigns, pipeline, win rates, quota. Ask where revenue actually came from last year and the answer is usually different. A large share arrived from customers who were already there, through renewals, more seats, more usage and additional products.
The gap between those two answers is what a revenue flywheel is meant to close. This guide covers what the model is, where it genuinely differs from the sales funnel, how the stages connect across marketing, sales and customer success, what to measure, and how to build one without turning it into an org chart exercise.
Quick Takeaway
- A revenue flywheel is an operating model, not a diagram. It only does anything if the friction between marketing, sales and customer success is actually removed, and if someone owns revenue after the contract is signed as seriously as someone owns it before.
A Revenue Flywheel Is a Model Where Each Customer Makes the Next One Easier
A revenue flywheel is a growth model in which acquisition, retention, expansion and advocacy connect into a continuous cycle, so that existing customers generate more revenue and make future acquisition cheaper, rather than being treated as the end of a sales process.
The metaphor comes from Jim Collins. On his own summary of the concept, Collins describes good-to-great transformations as having no single defining action, no grand program, no one killer innovation and no miracle moment, but instead resembling relentlessly pushing a giant, heavy flywheel, turn upon turn, building momentum until a point of breakthrough. He expanded the idea in a 2019 monograph, Turning the Flywheel.
Applied to go-to-market, the idea reached B2B mainstream through HubSpot. Its CEO Brian Halligan argued in Harvard Business Review in 2018 for replacing the sales funnel with a sales flywheel, and HubSpot described its own flywheel as a cycle of attracting, engaging and delighting customers.
Two things worth saying plainly before going further. The flywheel is a company-level philosophy rather than a mechanism you can instrument directly, which is both its strength and its weakness. And it is closely related to two other models we cover: growth loops, which are specific mechanisms rather than a whole-company view, and product-led growth, which is one particular way of turning the wheel. See our guide to B2B growth loops and guide to product-led growth.
How the Revenue Flywheel Works
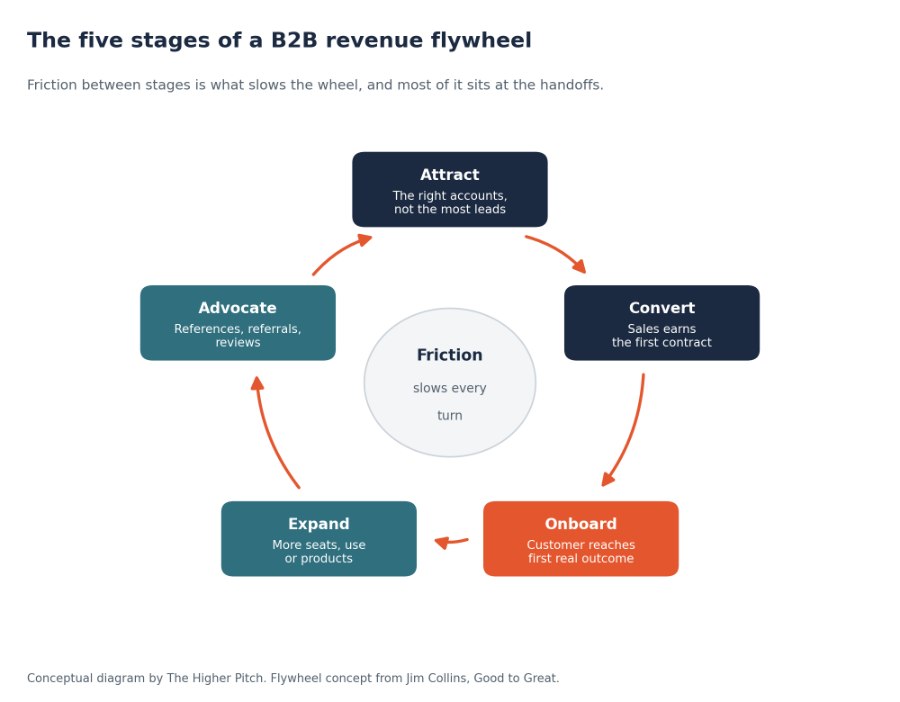
Figure 1: The five stages, with friction at the centre. Conceptual diagram.
The mechanics are simple to state and hard to run:
- Force applied at any stage speeds the whole wheel. A better onboarding experience does not only improve onboarding; it improves retention, expansion and advocacy downstream.
- Friction anywhere slows it. A bad handoff between sales and customer success costs you expansion revenue months later.
- Momentum carries. Each satisfied customer reduces what the next acquisition costs, through references, reviews, referrals and reputation.
The last point is the one to test honestly in your own business. If a happy customer changes nothing about how the next deal is won, you do not yet have a flywheel; you have a funnel with a customer success team attached.
Where the Sales Funnel Stops
| Dimension | Sales funnel | Revenue flywheel |
| Shape | Linear, ending at closed won | Circular, continuing through the relationship |
| The customer is | The output | The input to the next cycle |
| Revenue focus | New business | New business, retention and expansion together |
| What you optimize | Stage conversion | Friction across the whole lifecycle |
| Who owns revenue | Sales | Marketing, sales and customer success together |
| Growth pattern | Proportional to input | Compounds when retention and expansion are strong |
Table 1: The core differences. The full comparison is in Revenue Flywheel vs Sales Funnel.
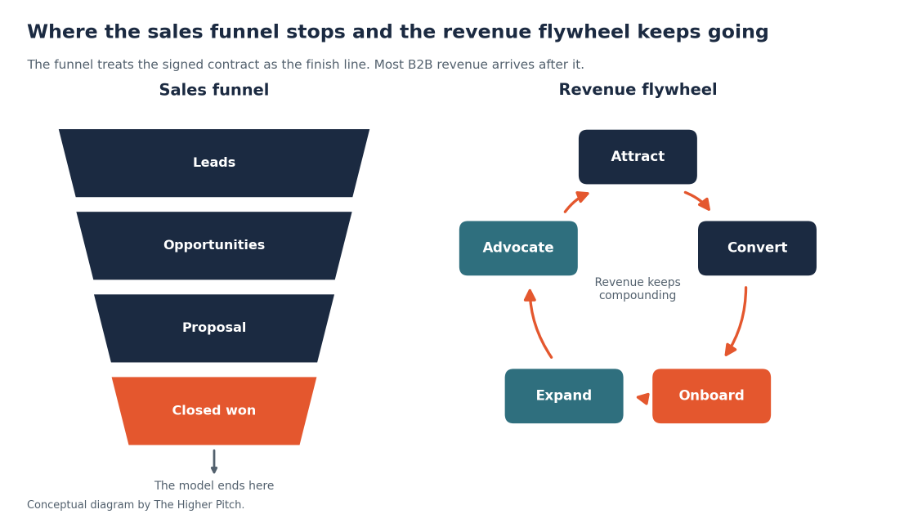
Figure 2: Where the funnel stops. Conceptual diagram.
The funnel is not wrong. It remains the right tool for forecasting and for diagnosing where deals stall. What it cannot do is describe where most B2B revenue comes from over time, because it has no vocabulary for anything after the signature.
Why This Matters More in B2B Than the Metaphor Suggests
Three pieces of evidence make the case better than the metaphor does.
Buyers arrive with history, so past customers shape future acquisition. 6sense’s 2025 B2B Buyer Experience Report, covering nearly 4,000 buyers, found that in 85% of successful purchases buyers had prior direct experience with the vendor, that 97% had prior experience with at least one vendor on their shortlist, and that the winning vendor was already on the Day One shortlist 95% of the time. Your existing customers and past evaluators are, in effect, your future pipeline.
Buying is a loop, not a line. Gartner describes B2B purchases as six buying jobs that buyers revisit rather than complete in order, which makes a strictly linear model a poor description of the journey even before the contract.
Retention economics have been understood for decades, and are usually misquoted. You will often see the claim that a 5% increase in retention raises profits by 25% to 95%. The source is Frederick Reichheld and W. Earl Sasser’s 1990 Harvard Business Review article Zero Defections: Quality Comes to Services. What that article actually reports is a set of company-specific results: reducing the defection rate by 5% generated 85% more profits in one bank’s branch system, 50% more in an insurance brokerage and 30% more in an auto-service chain, and MBNA America halving a 10% defection rate saw profits rise 125%. The authors note the magnitude varies by company and industry while the pattern holds.
That is a weaker claim than the internet version, and still a strong one. We would use the honest framing rather than the rounded-up one, as we cover in how retention and expansion power the flywheel.
The Five Stages, and What Each Owes the Next
| Stage | What it produces | What breaks it |
| Attract | Awareness and demand among the right accounts | Volume targets that reward poor-fit leads |
| Convert | A first contract with expectations the business can meet | Deals sold on promises delivery has not agreed to |
| Onboard | A customer who reaches a real outcome quickly | No defined first value, or an unowned handoff |
| Expand | More seats, usage or products as value grows | Expansion pursued before the first outcome landed |
| Advocate | References, referrals and reviews that lower future CAC | Nobody owning the ask, or asking at the wrong moment |
Table 2: The five stages. Examples of each motion are in 7 Revenue Flywheel Examples.
The “what breaks it” column is the useful one. Each failure is an incentive problem rather than an effort problem, which is why flywheel work usually starts with compensation and definitions rather than with process maps.
Acquisition, Retention and Expansion Are Not Equal Contributors
Most B2B companies invest as though acquisition is the whole business, then discover that the difference between cohorts is decided after the sale.
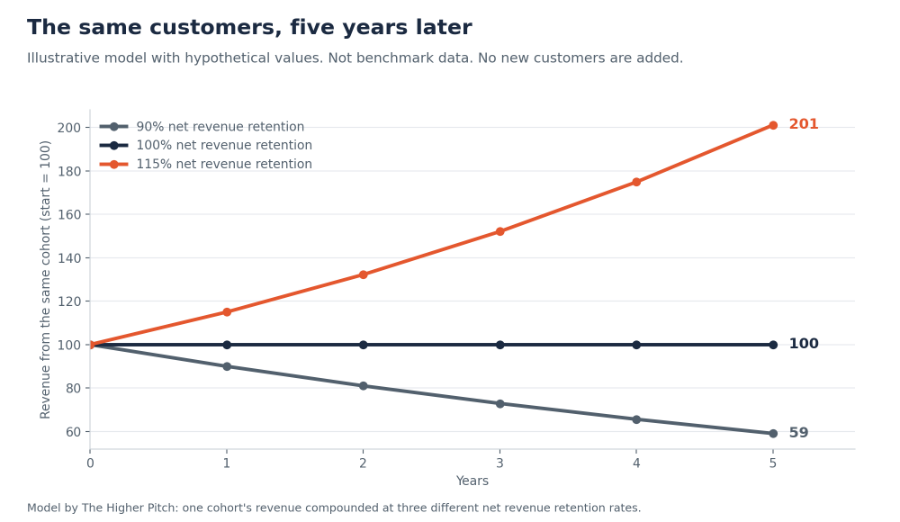
Figure 3: Illustrative model with hypothetical values, not benchmark data. With no new customers added, a cohort at 115% net revenue retention roughly doubles over five years, while one at 90% loses about 40% of its revenue.
The numbers are invented; the shape is not. The same acquisition engine produces radically different businesses depending on what happens after the sale. That is why net revenue retention, rather than lead volume, is the number a flywheel model puts in front of the board.
Customer Experience Is the Mechanism, Not a Value
Talking about customer experience in the abstract achieves nothing. In a flywheel it has a specific job: reducing friction at the points where the wheel slows.
In practice that means a short list of concrete things: a first outcome reached quickly after go-live, support that resolves issues without the customer chasing, a product or service that matches what was sold, and a relationship that survives the departure of the person who championed you. Our pieces on user onboarding for product success, reducing friction and customer experience analytics cover the mechanics.
Marketing, Sales and Customer Success Have to Share the Wheel
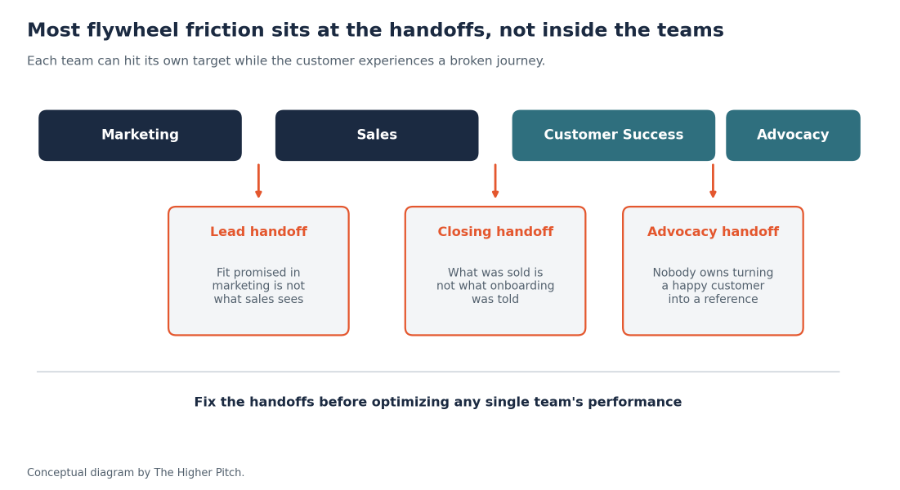
Figure 4: Where friction actually sits. Conceptual diagram.
The structural problem is that each team can hit its own target while the customer experiences a broken journey. Marketing hits lead volume with poor-fit accounts. Sales hits quota with commitments delivery cannot meet. Customer success absorbs the consequences and has no say in either.
Three fixes that change behaviour rather than diagrams:
- Shared definitions. One agreed definition of a good-fit account, used by all three teams.
- Shared metrics. At least one metric each team is measured on that they cannot move alone, such as net revenue retention or expansion from new cohorts.
- Owned handoffs. Each handoff has a named owner, a checklist and a deadline, not just a CRM stage change.
This is the operating layer our RevOps playbook covers in detail, and it depends on trustworthy data, which is where CRM data quality comes in.
What Each Leader Needs to Agree
| Leader | The question they bring | What resolves it |
| CEO | Is growth becoming less dependent on new logos? | Share of revenue from existing customers, by cohort |
| CFO | Where should the next dollar go, acquisition or retention? | CAC and LTV by segment, plus net revenue retention |
| CMO | Does marketing’s remit extend past the sale? | A defined role in onboarding, advocacy and expansion |
| CRO or sales leader | Does this change what my team is paid for? | Compensation tied to retention or expansion, not just new bookings |
| Customer success leader | Do I have influence, or only accountability? | A voice in qualification and in what gets promised |
| RevOps or CIO | Can we measure a cohort across its whole life? | A shared data model spanning pre- and post-sale |
Table 3: The internal buying-committee lens on adopting a flywheel model.
The CRO row is where most flywheel initiatives quietly die. If sales is compensated solely on new bookings, no amount of shared language will change what gets sold to whom.
Metrics: Read the Chain, Not the Links
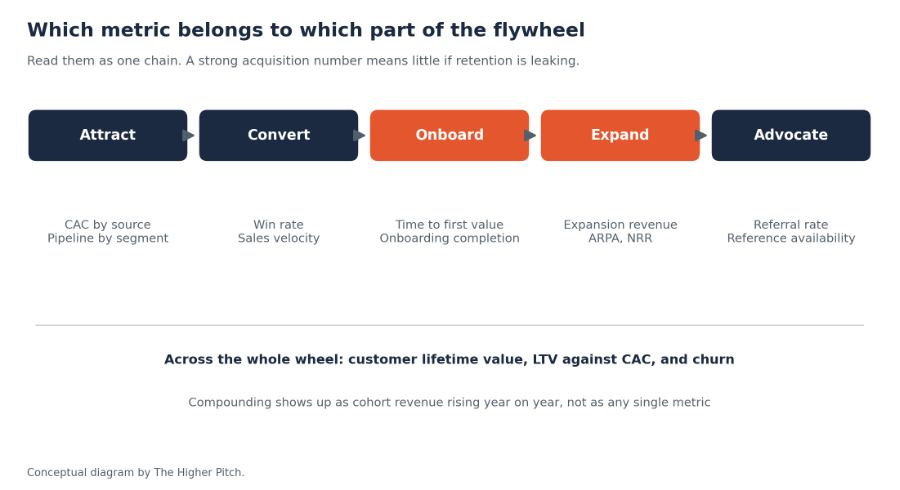
Figure 5: Which metric belongs where. Conceptual diagram.
The measures that matter across the wheel are customer acquisition cost by source, customer lifetime value, retention and churn, expansion revenue, net revenue retention, average revenue per account, sales velocity and referral rate. What distinguishes flywheel measurement from funnel reporting is reading them as one chain and by cohort, so you can see whether later cohorts are performing better than earlier ones. The full set is in Revenue Flywheel Metrics.
Six Mistakes That Stop the Wheel Turning
- Renaming the funnel. Drawing a circle changes nothing if targets and compensation are unchanged.
- Leaving sales compensation alone. The strongest signal in any revenue organization is what people are paid for.
- Treating customer success as support. A team with no influence over qualification cannot be accountable for retention.
- Chasing expansion before the first outcome. Upselling a customer who has not yet seen value accelerates churn.
- Measuring in aggregate rather than by cohort. Aggregate retention hides whether recent cohorts are getting better or worse.
- Automating a broken handoff. Automation makes a bad process faster, not better.
AI and Automation Speed the Wheel, and Amplify Its Faults
The useful applications are unglamorous: surfacing churn risk from usage and engagement signals, flagging expansion readiness, summarizing account history so any team member can pick up a conversation, routing advocacy requests when an account hits a defined outcome, and keeping CRM records current so cohort analysis is possible at all.
Two cautions. First, all of it depends on data quality, and predictions built on duplicated contacts and overwritten sources are confident and wrong. Second, automation applied to an unowned handoff produces a faster unowned handoff. Our pieces on AI marketing automation and moving from manual to automated marketing cover the tooling, and THP’s SAID approach is built around tying AI to business outcomes rather than activity.
How to Build a Revenue Flywheel Strategy
- Measure where revenue actually came from last year, split into new, retained and expansion.
- Map the full lifecycle as customers experienced it, including the handoffs.
- Find the biggest friction point and fix that one first.
- Agree shared definitions of a good-fit account across all three teams.
- Change at least one incentive so that someone is paid for what happens after the sale.
- Build the retention and expansion motions deliberately, with triggers and owners.
- Instrument cohorts, so you can tell whether newer ones are performing better.
- Review quarterly against the chain, not against each team’s own scorecard.
The detailed method is in How to Build a B2B Revenue Flywheel From Scratch.
THP Studio Perspective
- The flywheel’s weakness is that it is easy to agree with and easy to implement cosmetically. We have seen the diagram on plenty of strategy decks in companies where marketing is still measured on leads, sales on new bookings and customer success on ticket closure. Nothing about the wheel changes that. The test we would apply is narrow and awkward: name one metric this quarter that a single team cannot move alone, and one person whose compensation depends on revenue that arrives after the contract is signed. If neither exists, the model is a picture.
Frequently Asked Questions
Key Takeaways
- Judge whether you have a flywheel by one test: does a satisfied customer change how the next deal is won?
- Treat friction at the handoffs, not performance inside teams, as the main thing slowing revenue.
- Use net revenue retention rather than lead volume as the headline number, since it decides what a cohort becomes.
- Use the Reichheld and Sasser findings honestly: company-specific 1990 results, not a universal law.
- Change at least one incentive so someone is paid for revenue that arrives after the contract is signed.
Work With THP’s Integrated Marketing & Demand Practice
- THP’s Integrated Marketing & Demand team connects brand, content, campaigns and technology into programs measured by pipeline and revenue rather than activity. If your growth still depends almost entirely on new logos, mapping where revenue actually comes from is a practical first step.
Author