The funnel has survived every announcement of its death for one reason: a CFO can forecast with it. Stage conversion rates multiply out to a number, the number goes in a plan, and the plan gets approved. No flywheel diagram has ever done that.
So the useful comparison is not which model is more modern. It is which question each one answers, and what happens to revenue that the funnel simply cannot see. This article covers both, and is specific about when a B2B team should keep the funnel exactly as it is. For the model in full, see our guide to the revenue flywheel.
Quick Takeaway
- The funnel models a deal. The flywheel models a customer relationship. Most B2B companies need both, because the funnel forecasts new business and cannot describe the revenue that arrives in years two, three and four.
The Sales Funnel Models a Deal
A sales funnel is a staged model of how an opportunity progresses from first contact to a signed contract, used to measure conversion between stages and to forecast revenue.
Its strengths are real and worth defending. It assigns accountability by stage, makes drop-off visible, supports capacity planning, and produces a forecast. When a board asks how much will close next quarter, the funnel answers.
Its limitation is scope. The model ends at the signature, so everything that happens afterwards, which in most B2B businesses is where the majority of lifetime revenue sits, falls outside it.
The Revenue Flywheel Models a Relationship
A revenue flywheel is a growth model in which acquisition, retention, expansion and advocacy connect into a continuous cycle, so existing customers produce further revenue and make future acquisition easier.
The metaphor comes from Jim Collins, whose flywheel concept describes transformation as relentlessly pushing a heavy wheel, turn upon turn, with no single defining action or miracle moment. HubSpot applied it to go-to-market: CEO Brian Halligan argued in Harvard Business Review in 2018 for replacing the sales funnel with a sales flywheel, and HubSpot described its own as a cycle of attracting, engaging and delighting customers.
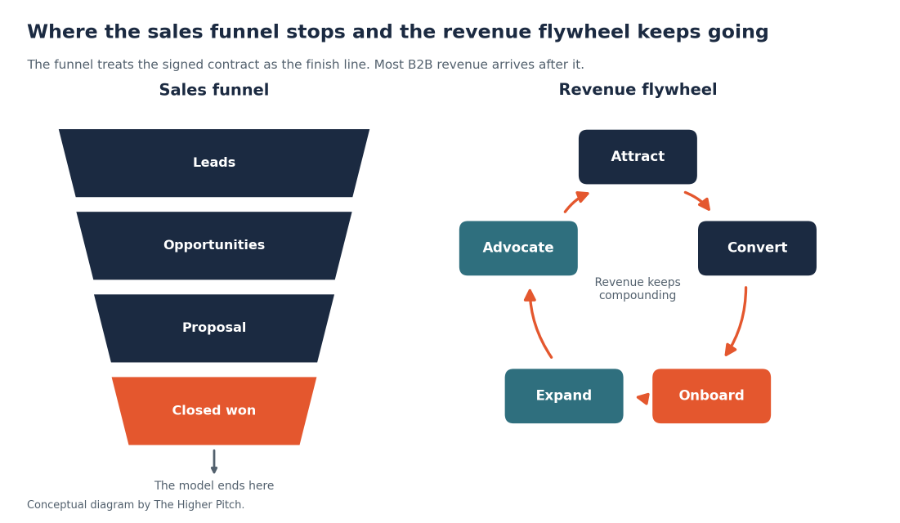
Figure 1: Where the funnel stops. Conceptual diagram.
Six Differences That Change What Gets Managed
| Dimension | Sales funnel | Revenue flywheel |
| Unit of analysis | The opportunity | The customer relationship |
| End point | Closed won | There isn’t one |
| Revenue in scope | New business | New, retained and expansion revenue |
| Primary lever | Stage conversion | Friction across the lifecycle |
| Ownership | Sales, with marketing feeding it | Marketing, sales and customer success together |
| What good looks like | A reliable forecast | Later cohorts outperforming earlier ones |
Table 1: How the two models differ.
For the equivalent comparison applied to marketing mechanisms rather than revenue, see Growth Loops vs Marketing Funnel.
Linear Revenue and Compounding Revenue Behave Very Differently
In a funnel model, revenue is a function of input. More pipeline, held at the same conversion rates, produces more bookings. Stop spending and the flow slows. That is linear, predictable and easy to plan around.
In a flywheel model, a second source of revenue runs alongside: the existing base, growing or shrinking depending on retention and expansion. That component compounds, in either direction.
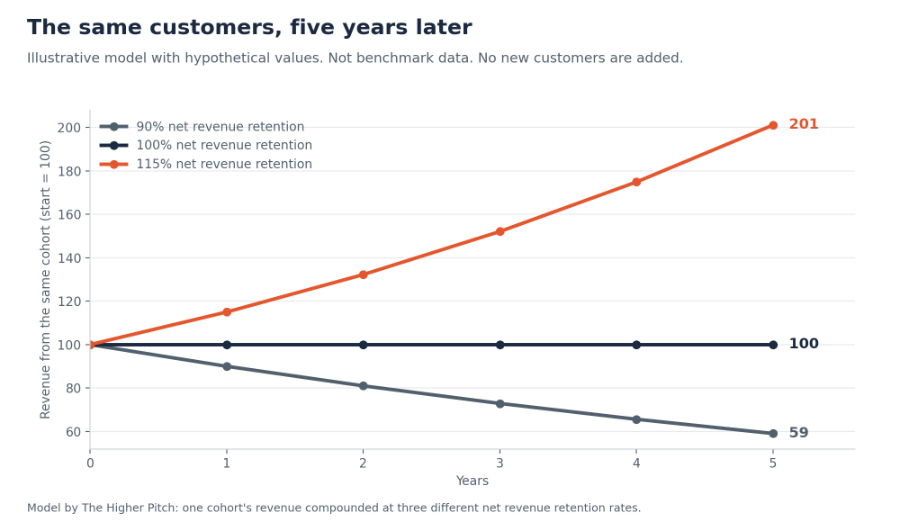
Figure 2: Illustrative model with hypothetical values, not benchmark data. With no new customers added, a cohort at 115% net revenue retention roughly doubles over five years while one at 90% loses about 40% of its value.
Two consequences follow:
- Acquisition and retention are not interchangeable investments. A dollar spent improving retention affects every future year of an existing cohort. A dollar spent on acquisition affects one new cohort.
- The direction matters more than the level. A business at 90% net revenue retention has to run acquisition faster every year just to stand still.
The retention economics behind this are older than the flywheel language. Reichheld and Sasser’s 1990 Harvard Business Review article reported that reducing the defection rate by 5% generated 85% more profits in one bank’s branch system, 50% more in an insurance brokerage and 30% more in an auto-service chain, with the authors noting the magnitude varies by company and industry while the pattern holds. The much-repeated “25% to 95%” version is a rounding of those specific cases, not a general finding.
Customer Acquisition Versus Customer Lifecycle
| Moment | What the funnel sees | What the flywheel sees |
| A poor-fit deal closes | A win, counted at full value | A future churn risk and a support cost |
| A customer renews | Nothing | Revenue retained, and a signal about fit |
| A customer adds seats | Nothing, or a new opportunity | Expansion revenue and evidence of value |
| A champion leaves | Nothing | A relationship risk requiring action |
| A customer refers a peer | A new lead | The flywheel doing its job |
| A customer churns | Nothing | Lost revenue and a lesson about qualification |
Table 2: Six moments, and what each model registers.
The first row is the one worth arguing about internally. In a funnel model a poor-fit win is unambiguously good, because it is a win. In a flywheel model it is a liability that will show up eighteen months later as churn, a bad reference and a support burden. That difference is an incentive design problem, not a philosophical one.
Retention and Expansion Are the Flywheel’s Distinctive Contribution
Retention keeps the base intact; expansion grows it. Together they determine whether the existing customer base is an asset or a leaking bucket.
Three practical points:
- Expansion usually outgrows new business at scale. In mature B2B businesses, adding seats, usage or products to existing accounts is typically the largest revenue line.
- Expansion is earned, not sold. Pursuing an upsell before the customer has reached a first outcome tends to accelerate churn rather than revenue.
- Advocacy is the part that closes the loop. Without references, referrals and reviews, retention and expansion are still linear; they simply extend one relationship rather than making the next one cheaper.
Detail is in how retention and expansion power the flywheel, and the buying-side evidence is strong: 6sense’s 2025 report found that in 85% of successful purchases buyers had prior direct experience with the vendor.
Which Model Fits B2B Growth?
| Situation | Lean toward | Why |
| Early-stage, few customers | Funnel | There is no base to compound yet |
| Board wants a quarterly forecast | Funnel | The flywheel produces no forecast |
| Deals stalling at a known stage | Funnel | Stage conversion isolates the problem |
| One-off or infrequent purchases | Funnel | Little retention or expansion to manage |
| Subscription or recurring revenue | Flywheel | Most lifetime value arrives post-sale |
| Rising acquisition costs | Flywheel | Advocacy and retention lower the cost of the next deal |
| High churn despite strong bookings | Flywheel | The funnel cannot see the problem at all |
Table 3: When to lead with each model.
Committee dynamics matter here too, because different leaders experience the two models differently.
| Role | What the funnel gives them | What the flywheel adds |
| CFO | A forecast and capacity plan | Cohort economics and LTV against CAC |
| CRO | Quota attainment and stage conversion | Accountability for revenue after the sale |
| CMO | Pipeline contribution | A role in advocacy and expansion |
| Customer success leader | Nothing; they sit outside it | A seat in qualification and in targets |
| CEO | How much will close | Whether growth is becoming less dependent on new logos |
Table 4: The internal buying-committee lens.
Running Both Without Confusion
The practical arrangement is straightforward. Keep the funnel as the forecasting spine, and add a lifecycle view around it that covers everything after closed won.
- Do not delete funnel reporting. Nothing in the flywheel forecasts.
- Extend the data model past the sale, so a cohort can be followed from first touch to renewal and expansion.
- Add cohort reporting alongside stage conversion.
- Give each handoff an owner, particularly the one between sales and delivery.
- Change one incentive, so at least one team carries a metric it cannot move alone.
- Report both, until the relationship between funnel activity and cohort outcomes is understood.
The operating layer is covered in our RevOps playbook, and the systems side in our piece on HubSpot CRM as a catalyst for sales.
A B2B Example: The Same Year, Read Two Ways
Consider a hypothetical company selling workforce management software to healthcare providers. This is an illustration, not a client.
Read through the funnel, the year looks strong: pipeline up, win rate steady, bookings ahead of plan. Sales exceeded quota and marketing exceeded its lead target.
Read through the flywheel, the same year looks different. A third of new logos came from a segment where implementation regularly overruns, so onboarding is behind and early usage is low. Net revenue retention has slipped below 100%, meaning the base is shrinking. Two reference customers have gone quiet since their champions left. Expansion revenue, which funded last year’s growth, has flattened.
What changes. The company keeps the funnel for forecasting and adds three things: a fit definition agreed by sales and delivery that excludes the problem segment, a retention metric in the sales compensation plan, and an advocacy trigger thirty days after a customer reaches a defined outcome. None of these appear on a funnel report, and all of them affect next year’s revenue.
THP Studio Perspective
- Our caution to any team making this shift is to protect the funnel while they do it. We have watched companies get excited about a lifecycle model, deprioritize stage reporting, and then find at the next board meeting that nobody can explain the forecast. The flywheel is a better description of where revenue comes from and a worse tool for predicting when it arrives. Run them side by side, be explicit that one is for forecasting and the other for deciding where to invest, and do not let the more fashionable model quietly displace the one finance actually relies on.
Frequently Asked Questions
Key Takeaways
- Keep the funnel for forecasting, since nothing in the flywheel model predicts when revenue arrives.
- Treat a poor-fit win as a liability rather than a win, which is the clearest behavioural difference between the models.
- Recognize that retention and acquisition are not interchangeable investments, because one compounds across every future year.
- Add cohort reporting alongside stage conversion rather than replacing one with the other.
- Change at least one incentive, or the lifecycle view will remain a reporting layer with no effect on behaviour.
Work With THP’s Campaigns & Demand Generation Studio
- THP’s Campaigns & Demand Generation Studio builds B2B demand programs measured on pipeline and revenue rather than lead volume. If your funnel looks healthy while retention does not, connecting the two views is usually where the useful conversation starts.
Author