
Flywheel projects usually begin with a workshop and end with a diagram. Marketing, sales and customer success agree that the customer should be at the centre, someone draws a circle, and eighteen months later the compensation plans, targets and handoffs are exactly as they were.
The work that changes revenue is narrower and considerably less pleasant: finding where the wheel actually catches, agreeing definitions that constrain what gets sold, and changing at least one incentive. This guide sets out that sequence with a worked example throughout. For the model, see our guide to the revenue flywheel.
Quick Takeaway
- Do the friction audit before the strategy work. Most companies already know their revenue model; what they do not know is which handoff is quietly costing them a quarter of their expansion revenue.
- The worked example (hypothetical). Throughout this guide we follow an illustrative company selling field service management software to mid-market utilities and infrastructure contractors. It is not a client. Bookings are growing, net revenue retention is drifting below 100%, and expansion has flattened.
Step 1: Define What the Flywheel Is For
“Grow revenue” is not an objective. Name the specific revenue problem, because it determines which part of the wheel to work on first.
| The problem | Where the wheel is stuck | What to build first |
| Rising acquisition cost | Advocacy is missing | Reference and referral motion |
| Strong bookings, flat revenue | Retention is leaking | Onboarding and customer success |
| Good retention, no growth in base | Expansion is unowned | Expansion triggers and ownership |
| Churn concentrated in one segment | Fit discipline in qualification | Shared definition of a good-fit account |
Table 1: Matching the problem to the starting point.
Worked example: the objective is to return net revenue retention above 100% within a year, with expansion from existing accounts as the main lever.
Step 2: Map the Complete Customer Lifecycle as Customers Experienced It
Map the last twenty customers end to end: first touch, sales process, contract, onboarding, first outcome, renewal, expansion, advocacy and, where relevant, churn. Use CRM history and conversations with the customers themselves.
Two things to record at each stage that most maps omit: who owned it, and what the customer had to do that they did not expect.
Gartner describes B2B buying as six jobs that buyers loop through rather than complete in order, so expect the pre-sale portion of the map to be messier than your funnel suggests.
Worked example: the map shows that implementation regularly slips because customers must supply asset data nobody warned them about during the sales process. That single omission delays first value by weeks and pushes the first expansion conversation past the renewal.
Step 3: Identify Your Flywheel Stages
Use whatever stage names match how your business actually works. A workable B2B default is attract, convert, onboard, expand and advocate.
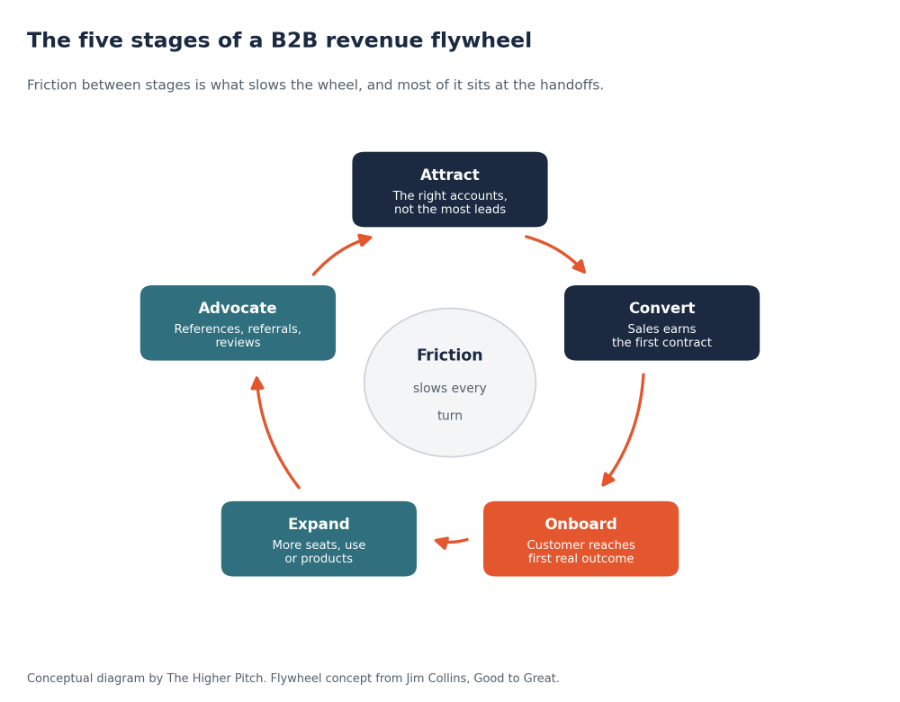
Figure 1: The five stages. Conceptual diagram.
For each stage, write down three things: the observable event that marks entry, the owner, and the outcome the customer should have by the time they leave it. Stages without an observable entry event cannot be measured, and stages without an owner do not improve.
Step 4: Run a Friction Audit
This is the step that produces the actual work. Friction is anything that costs the customer time, effort or confidence, and most of it sits at the handoffs rather than inside the teams.
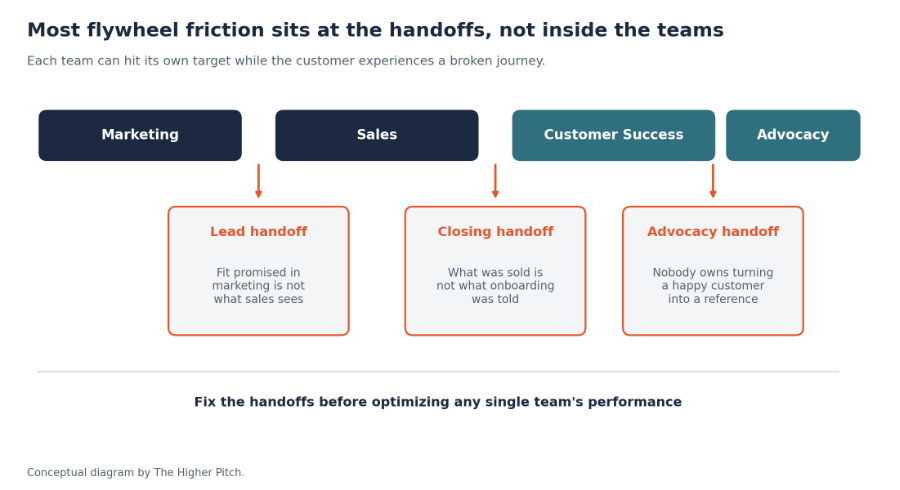
Figure 2: Where friction sits. Conceptual diagram.
| Handoff | Questions to ask | Typical finding |
| Marketing to sales | Do both teams define a good-fit account the same way? | Volume targets are pulling in accounts sales cannot win |
| Sales to delivery | Does delivery see what was promised, in writing? | Commitments made in the last week of the quarter |
| Onboarding to success | Who owns the first outcome, and by when? | Nobody, or it is assumed to be the customer |
| Success to expansion | What triggers an expansion conversation? | A renewal date, rather than customer progress |
| Success to advocacy | Who asks, and when? | Nobody, or marketing asks at a random moment |
Table 2: A friction audit across the five handoffs.
Rank findings by revenue impact rather than by how annoying they are. Then fix one.
Step 5: Define the Value Created at Each Stage
Worked example: the highest-impact finding is the sales-to-delivery handoff, because the data requirement is known during sales but never documented.
For each stage, write what the customer gets, not what your team does. “Run kickoff call” is an activity. “Customer knows exactly what they must supply, and by when” is value.
This matters because it exposes stages that exist for internal reasons. Any stage where you cannot state customer value is a candidate for removal, which is the cheapest friction reduction available.
Step 6: Connect Marketing, Sales and Customer Success
Three changes do the work. Everything else is coordination theatre.
- One shared definition of a good-fit account, agreed by all three teams and applied in qualification. Delivery gets a veto.
- At least one shared metric that no single team can move alone, such as net revenue retention or expansion revenue from recent cohorts.
- One incentive change, so someone is compensated for revenue that arrives after the contract is signed.
The third is the one that meets resistance and the one that changes behaviour. A revenue organization does what it is paid for, whatever the strategy deck says. Our RevOps playbook covers the operating model, and campaign management maturity covers assessing readiness honestly.
Worked example: sales compensation adds a modest component tied to 12-month retention of accounts they closed, and delivery gains a formal sign-off on scope before contracts are issued.
Step 7: Build Retention and Expansion Motions Deliberately
These rarely happen on their own. Each needs a trigger, an owner and a deadline.
| Motion | Trigger | Owner and action |
| First-value check | 30 days after go-live | Customer success confirms the defined outcome is reached |
| Risk intervention | Usage or engagement drop against a defined threshold | Customer success contacts within a set window |
| Expansion conversation | Customer reaches a defined outcome or usage level | Account manager, with the usage context in hand |
| Renewal preparation | A fixed period before renewal date | Customer success, with a documented value summary |
| Advocacy request | A measurable result confirmed by the customer | Marketing, with something in it for the customer |
| Champion change | Contact role change detected in the CRM | Account manager re-establishes the relationship |
Table 3: Six motions with triggers and owners.
The last row is the one most often missing, and in B2B it is a frequent cause of quiet churn: the person who chose you leaves, and nobody notices until renewal. Detail is in how retention and expansion power the flywheel.
Step 8: Automate the Repeatable Parts, Not the Judgment
Automate triggers, alerts, data capture, routing and reporting. Keep the conversations, the judgment about whether an account is genuinely ready, and the decision to escalate with people.
Two conditions before automating anything:
- The process works manually first. Automation makes a broken handoff faster, not better.
- The data is trustworthy. Churn scores built on duplicated contacts and overwritten sources will be confidently wrong. Start with the signs your CRM data is holding back growth and cleaning CRM data.
Our guides to HubSpot implementation and HubSpot marketing automation cover the tooling side.
Step 9: Measure the Flywheel, Not the Teams
Instrument so a cohort can be followed from first touch through renewal and expansion. At minimum:
- CAC by source and segment, with fully loaded costs.
- Time to first value, by segment.
- Net revenue retention by cohort, which is the headline.
- Expansion revenue, separated from renewals.
- Referral and reference rate.
- Churn, with reasons recorded in a structured field rather than free text.
Report by cohort rather than in aggregate, because that is the only way to see whether the changes you made are working on newer customers. The full set is in Revenue Flywheel Metrics.
Worked example: the company adds three CRM fields (first value date, expansion trigger date, churn reason) and starts reporting net revenue retention by quarterly cohort.
Step 10: Optimize and Scale
Fix the biggest friction point, confirm it moved the metric it was supposed to move, then take the next one. Resist working on several at once, because you will not know what caused what.
Scale in three ways: extend a motion to more segments, add the next motion, or raise the standard of the one you have. Agree the stop rule too, so that a motion with no effect after an agreed period is redesigned rather than quietly maintained.
Your Revenue Flywheel Build Checklist
| Field | Question to answer | Worked example answer |
| Objective | Which revenue problem is this for? | Return net revenue retention above 100% |
| Lifecycle map | How did the last 20 customers experience us? | Implementation slips on undisclosed data requirements |
| Stages | What are the entry events and owners? | Five stages, each with an event and owner |
| Biggest friction | Which handoff costs the most revenue? | Sales to delivery |
| Shared definition | What is a good-fit account? | Agreed by all three teams, delivery has a veto |
| Shared metric | What can no team move alone? | Net revenue retention |
| Incentive change | Who is paid for post-sale revenue? | Sales, on 12-month retention |
| Motions | Which triggers, which owners? | Six motions, each with a named owner |
| Data | What must we capture to measure cohorts? | First value date, expansion trigger, churn reason |
| Stop rule | What would end or redesign this? | Agreed with leadership at launch |
Table 4: Revenue flywheel build checklist.
THP Studio Perspective
- If a leadership team can only do one thing from this list, we would choose the friction audit, and we would have the sales and delivery leads run it together. It takes a week, it requires no new tooling, and it almost always surfaces one handoff that is quietly costing more revenue than any campaign will generate. It is also the step most likely to be skipped, because it produces uncomfortable findings about commitments made under quarter-end pressure. That discomfort is the value; a flywheel exercise that makes everyone feel good has probably not touched anything that matters.
Frequently Asked Questions
Key Takeaways
- Run the friction audit before any strategy work, because it is where the revenue-costing problems actually surface.
- Give each stage an observable entry event and a named owner, or it cannot be measured or improved.
- Get delivery a veto in qualification, since the sales-to-delivery handoff is the most common source of downstream churn.
- Build retention and expansion motions with explicit triggers, including one for champion changes.
- Report net revenue retention by cohort, which is the only way to see whether your changes are working.
Work With THP’s HubSpot Consulting Practice
- THP’s HubSpot Consulting team works on CRM strategy, lifecycle configuration and reporting, which is what makes cohort measurement possible. If your flywheel is designed but your systems cannot follow a customer from first touch to expansion, that gap is the constraint.
Author