
There is a specific way Loop Marketing measurement goes wrong, and it is worth naming before anything else. Three of the four stage metrics HubSpot publishes measure activity: how fast content is produced, how much it costs, and how many experiments run each month. All three are easy to improve. None of them tells you whether the business grew.
That is not a flaw in the scorecard, which is doing its job of measuring whether the loop is running. It is a risk in how the scorecard gets reported upward. This article covers what to measure at each stage, how to calculate it honestly, and what to pair it with so a faster loop is not mistaken for a better one. For the framework, see our guide to HubSpot Loop Marketing.
Quick Takeaway
- HubSpot’s scorecard tells you whether the loop is working as a process. It does not tell you whether the loop is working as a business decision. Add one outcome metric per objective, and report it beside the stage metrics rather than underneath them.
- Loop Marketing metrics are the stage-level measures that show whether each part of the loop is functioning, read alongside the commercial outcomes the loop was run to produce.
HubSpot Publishes a Scorecard With One Headline Metric Per Stage
On its Loop Marketing playbook page, HubSpot publishes a scorecard with a headline metric for each stage and advises tracking at stage level first, then rolling up to assess overall loop performance.
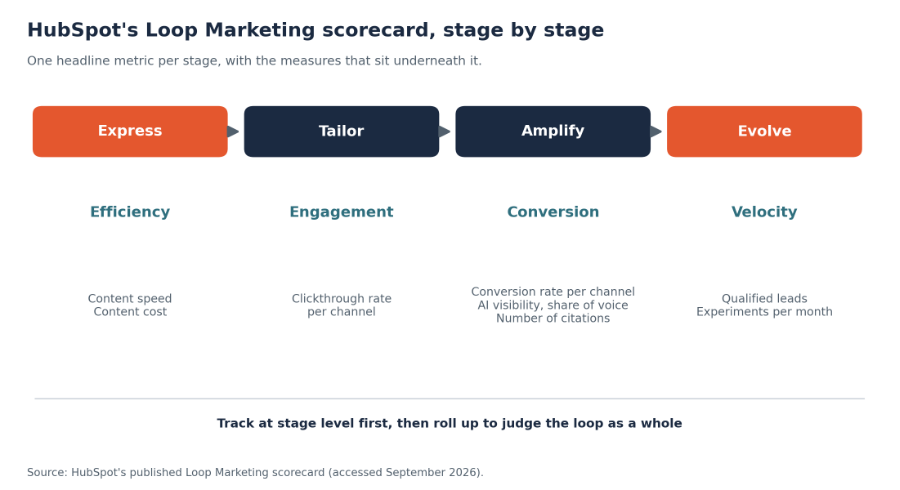
Figure 1: HubSpot’s published Loop Marketing scorecard.
| Stage | Headline metric | What HubSpot lists underneath | What it does not tell you |
| Express | Efficiency | Content speed (time to create and publish), content cost (budget per asset) | Whether the content was worth producing |
| Tailor | Engagement | Clickthrough rate per channel | Whether the right people clicked |
| Amplify | Conversion | Conversion rate per channel, AI visibility, AI share of voice, number of citations | Whether conversions became pipeline |
| Evolve | Velocity | Campaign performance (qualified leads), experiments per month | Whether the experiments changed anything |
Table 1: HubSpot’s scorecard, with what each metric leaves out.
The fourth column is not a criticism of HubSpot’s framework. It is the reason the next sections exist.
Express Stage: Measure Efficiency, but Judge Differently
Content speed is the average time from brief to publish. Content cost is budget divided by the number of assets created. Both are straightforward to calculate and both improve quickly once AI drafting is in use.
The honest caution: these are the easiest metrics in the whole framework to improve and the least connected to results. A team can halve content cost by publishing twice as much mediocre content. If Express efficiency is the number reported to leadership, that is the behaviour it will produce.
Two additions we would make:
- Share of assets a human substantially revised. If this drops toward zero, review has become a rubber stamp.
- Distinctiveness check. Periodically ask whether a competitor could have published the same piece. It is qualitative and it is the only Express measure that correlates with whether anyone remembers you.
Tailor Stage: Engagement, Read by Segment
Clickthrough rate per channel is HubSpot’s headline measure. Calculate it per segment as well as per channel, because an aggregate rate hides the thing you actually want to know: whether personalization is working differently for different audiences.
Additional measures worth tracking:
- Segment coverage: the share of your target audience that falls into a segment you can personalize for. Low coverage usually means data gaps.
- Reply and conversation rate for email, which is a better B2B signal than opens or clicks.
- Personalization accuracy: how often the wrong variant reaches the wrong person. This is a data quality indicator dressed as an engagement metric, and it is worth sampling manually.
If these numbers look unreliable, the problem is usually upstream. Start with the signs your CRM data is holding back growth.
Amplify Stage: Conversion Plus Three AI Visibility Measures
This is the stage where HubSpot’s scorecard gets most specific, listing conversion rate per channel alongside three AI measures.
AI visibility is defined by HubSpot as brand mentions divided by total responses. AI share of voice is how often you are mentioned compared with competitors. Number of citations is how often your website is cited in responses.
Three practical notes:
- Track at prompt level, not in aggregate. A healthy overall score can conceal complete absence on the selection-stage comparison prompts that decide shortlists.
- Citations are the actionable measure. Visibility scores move for reasons you do not control, including model updates. Citation analysis tells you which sources the answers are built from, which converts into work.
- Expect volatility. These numbers move without any change on your side, so read trends over months rather than reacting weekly.
Our Loop Marketing and AEO guide covers the measurement loop in detail, and share of AI voice as a marketing KPI covers that measure specifically.
On conversion rate per channel, the caution is familiar: channels that produce few, high-intent visits will show high conversion rates on small numbers. Report volume alongside rate.
Evolve Stage: Velocity, and Whether It Produces Anything
HubSpot’s headline measures here are campaign performance, expressed as qualified leads, and loop velocity, expressed as experiments per month.
Experiments per month is a useful operational measure and a poor performance measure. Ten experiments that each change nothing is worse than two that change something. Pair it with:
- Decision rate: the share of experiments that led to a documented change.
- Time from finding to change: the gap between learning something and acting on it. This is the number that actually reflects the loop’s promise, and most teams have never measured it.
- Repeat rate: how often the same finding recurs without being acted on, which exposes a broken feedback path.
Qualified leads is the one commercially meaningful metric in HubSpot’s scorecard, and it deserves scrutiny: qualified by whom, against what definition, and does sales agree? A loop that increases marketing-qualified leads while sales rejects them has improved a number and nothing else.
The Outcome Metrics the Scorecard Does Not Include
For each loop objective, add at least one measure the business recognizes:
| Objective | Outcome metric | Why the stage metrics are not enough |
| Demand in a segment | Qualified opportunities from that segment | Content speed and CTR can rise without pipeline |
| Brand presence | Branded search volume, direct traffic, AI share of voice trend | Engagement measures reward existing audiences |
| Product launch | Pipeline influenced in the launch window | Conversion rate per channel misses deal size |
| Efficiency | Cost per qualified opportunity | Cost per asset falls as quality falls |
| Retention or expansion | Expansion pipeline from existing customers | The scorecard is acquisition-shaped |
Table 2: Pairing each objective with an outcome measure.
There is also a reporting problem specific to this moment. As search clicks decline, traffic-based measures will fall even when marketing is working. SparkToro’s 2026 study found 68.01% of US Google searches ended without a click, up from 58.5% in its 2024 study, with Fishkin noting the years use different panels. A leadership team reading falling traffic as failing marketing will draw the wrong conclusion; we set out how to handle that conversation in why B2B website traffic is dropping.
Who Needs Which Numbers
| Leader | Question they ask | What to show them |
| CEO or founder | Is this producing growth or activity? | Outcome metric first, stage metrics as support |
| CFO | What are we getting for the spend and the credits? | Cost per qualified opportunity, plus tooling and credit consumption |
| CMO | Where is the loop stuck? | Stage metrics, decision rate, time from finding to change |
| Sales leader | Are these leads worth working? | Qualified opportunities and acceptance rate, by segment |
| RevOps or CIO | Can we trust the numbers? | Data coverage, attribution integrity, segment accuracy |
| Brand lead | Is volume costing us distinctiveness? | Share of assets substantially revised, plus the distinctiveness check |
Table 3: The internal buying-committee lens on loop reporting.
Getting this right depends on attribution and data quality, which our RevOps playbook and customer experience analytics pieces cover. The same measurement logic, applied to growth loops generally, is in growth loop metrics.
Measuring Continuous Improvement Across Loops
A single loop’s numbers tell you little. What matters is whether successive loops get better:
- Cycle time falls. Each loop completes faster than the last.
- Time from finding to change falls. The feedback path is tightening.
- Outcome per loop rises, measured by the objective’s own metric, not by output.
- Efficiency improves without quality falling, checked by the revision and distinctiveness measures.
If only content speed and experiment counts are improving, the loop is spinning faster without going anywhere. That is the specific failure this scorecard makes easy to miss, and the reason to report an outcome metric beside it every time.
THP Studio Perspective
- If we could change one thing about how this scorecard gets used, it would be the order of the slide. Content speed and experiments per month improve first, and look impressive long before pipeline moves. Put the outcome metric at the top and the stage metrics underneath as diagnostics, because the reverse order trains a team to optimize its own throughput. A loop producing content twice as fast and pipeline exactly as before has failed expensively, and the scorecard will say it is going well.
Frequently Asked Questions
Key Takeaways
- Report the outcome metric first and the stage metrics as diagnostics, or the team will optimize its own throughput.
- Treat Express efficiency as the most improvable and least meaningful number in the scorecard.
- Read Tailor and Amplify metrics by segment and by prompt, since aggregates hide exactly what you need to see.
- Add decision rate and time from finding to change, because experiments per month says nothing about whether anything changed.
- Expect traffic-based measures to fall as search clicks decline, and prepare that explanation before the quarterly review.
Work With THP’s HubSpot Consulting Practice
- THP’s HubSpot Consulting team works on CRM, reporting and attribution so that stage activity and commercial outcomes can be read in the same place. If your loop reporting shows activity improving while pipeline stays flat, the measurement setup is usually worth examining first.
Author